Ergo Foundation Treasury#
The Ergo Foundation initially received an allocation of 4,330,776 ERG, which is equivalent to 4.43% of the total supply.
Additionally, the Treasury exchanged 1,782,615 ERG for EFYT, a token issued on the Waves Platform in 2017 to build an early community through airdrops and raise funds before the Ergo mainnet launch.
After subtracting the 1,782,615 ERG exchanged for EFYT, the Ergo Foundation was left with 2,548,161 ERG, which is approximately 2.6% of the total supply.
A significant portion of this treasury has been withdrawn to fund protocol development, ecosystem infrastructure, market access, events, marketing, and other community work. The charts and tables below summarise those withdrawals and the Foundation's remaining reported holdings.
Quick links: Current Holdings · Withdrawals · Breakdowns · Salaries
(Please note that this summary is based on EF accounting records and, where available, information from EF Forum discussions and voting records. Before the current accounting records, accounting was managed by kushti, and a complete transaction-level record is not available. Most significant transactions should be reflected here.)
See Documented Accounting Breakdowns for additional category and yearly breakdowns.
For more information on Ergo's emission schedule, tokenomics and allocation, visit the emission section.
How to read this page
Current Holdings shows the latest reported balances. Treasury Funds Withdrawn tracks assets leaving EF-controlled wallets. Documented Accounting Breakdowns categorises the accounting records available for the period where the Foundation maintained detailed records. Figures are indicative and not audited.
Current Holdings#
The latest reported treasury balances are below. Balances and indicative prices last updated: June 2026.
| Asset | Indicative Amount | Indicative US$ Price | Indicative Total US$ Value |
|---|---|---|---|
| Liquid Assets in Self-Hosted Wallets | |||
| ERG | 2,506.4214 | 0.22069 | 553.14 |
| BTC | 0 | - | 0 |
| Subtotal - Liquid Assets | $553.14 | ||
| Illiquid Assets in Self-Hosted Wallets | |||
| SPF | 23,830,000 | 0.0001752 | 4,175.02 |
| Gluon | 335,000 | 1.00 | 335,000.00 |
| RSN | 30,000,000 | 0.006352 | 190,560 |
| Subtotal - Illiquid Assets | $529,735.02 | ||
| Total Liquid Assets | $553.14 | ||
| Total Assets | $530,288.16 |
The treasury is now mostly illiquid assets; liquid self-hosted funds are limited.
The former market-making fund held in centralised exchange wallets has been passed to the Sigmanauts to manage market making.
Liquid vs Illiquid Funds
The Ergo Foundation's remaining treasury consists mostly of illiquid ecosystem assets. Liquid ERG is limited, and the self-hosted BTC balance is currently zero.
Illiquid assets such as Gluon, SPF, and RSN are not treated as immediately spendable treasury. They may become more useful if the relevant markets deepen.
Wallets#
You can find the Ergo Foundation treasury and current balance on-chain at the following locations:
- EF Multi-sig for ERG + Tokens
- Hot Wallet managed by the Treasurer when sending payments.
- EF BTC Multi-sig
Treasury Withdrawals and Spending#
The Ergo Foundation has withdrawn the majority of its treasury allocation. These withdrawals funded development, listings and market making, marketing, events, grants, infrastructure, legal work, and operations.
Recalculated
These tables are rough guides using manual calculations of asset prices at the time of withdrawal. Categories are best-effort and may be refined as the records are consolidated. There is a large discrepancy between the total USD value of treasury withdrawals and the later category breakdowns because complete accounting records are not available for the full history.
Treasury Funds Withdrawn#
This table tracks assets leaving EF-controlled wallets. It is not the same as categorized accounting spend.
| Year | ERG | SPF | BTC | Total USD Value |
|---|---|---|---|---|
| 2026 | 20,958 | 0 | 0.12985400 | $17,144.07 |
| 2025 | 132,696 | 2,770,000 | 2.10064500 | $243,531 |
| 2024 | 209,646 | 1,627,500 | 1.95 | $372,217 |
| 2023 | 424,150 | 1,622,000 | - | $589,777 |
| 2022 | 723,000 | - | - | $2,247,640 |
| 2021 | 889,001 | - | - | $3,793,485 |
| 2020 | 1,080,000 | - | - | $500,292 |
| 2019 | 757,051 | - | - | $590,239 |
| Total | 4,236,502 | 6,019,500 | 4.18049900 | $8,354,325.07 |
Documented Accounting Breakdowns#
The charts and category tables below are based on the accounting period where the Ergo Foundation controlled and maintained detailed records. They do not reconcile to the full Treasury Funds Withdrawn total because earlier accounting records are incomplete or missing. Treat these breakdowns as best-effort summaries for the documented accounting period, not audited full-history totals.
The next section breaks the documented USD accounting records down by team, sub-team, end product, and salary distribution.
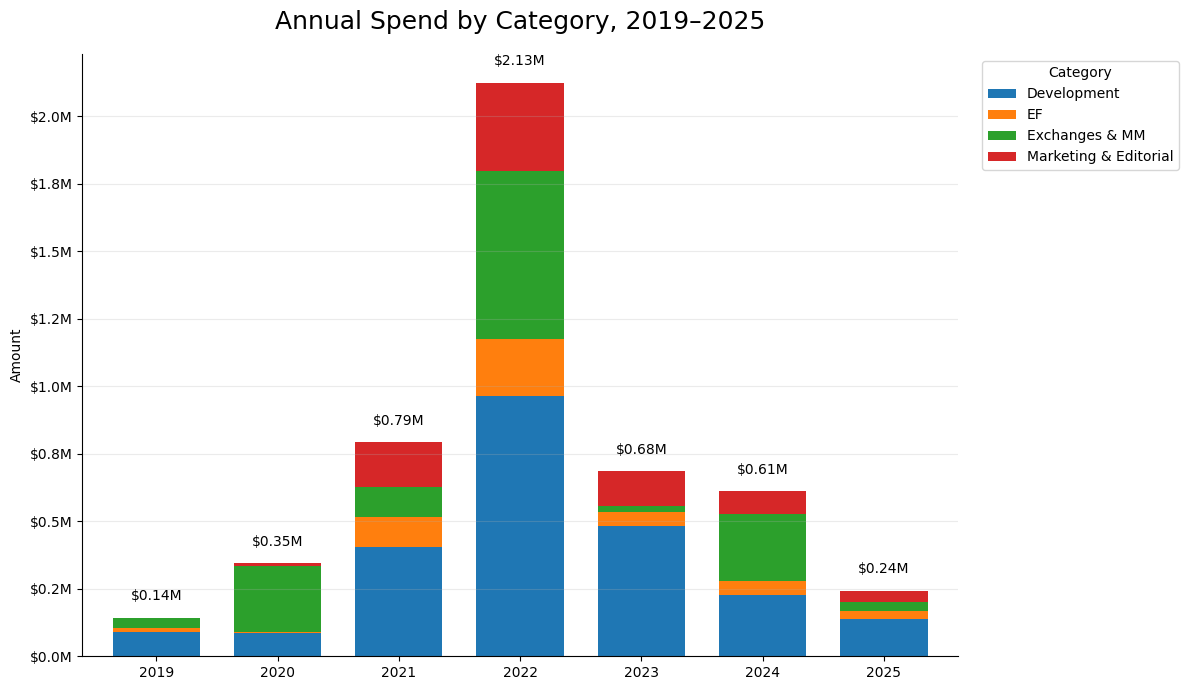
USD Withdrawals by Team#
| Year | Development | EF | Exchanges & MM | Marketing & Editorial | Grand Total |
|---|---|---|---|---|---|
| 2019 | 88,133 | 15,702 | 36,966 | 2,665 | 143,466 |
| 2020 | 85,638 | 6,002 | 242,904 | 11,048 | 345,592 |
| 2021 | 406,079 | 108,501 | 111,895 | 167,870 | 794,344 |
| 2022 | 963,218 | 212,628 | 623,634 | 325,577 | 2,125,056 |
| 2023 | 484,049 | 50,508 | 20,923 | 129,349 | 684,828 |
| 2024 | 226,806 | 52,205 | 248,414 | 84,991 | 612,416 |
| 2025 | 136,538 | 32,198 | 33,000 | 41,795 | 243,531 |
| Grand Total | 2,390,460 | 477,743 | 1,317,735 | 763,294 | 4,949,233 |
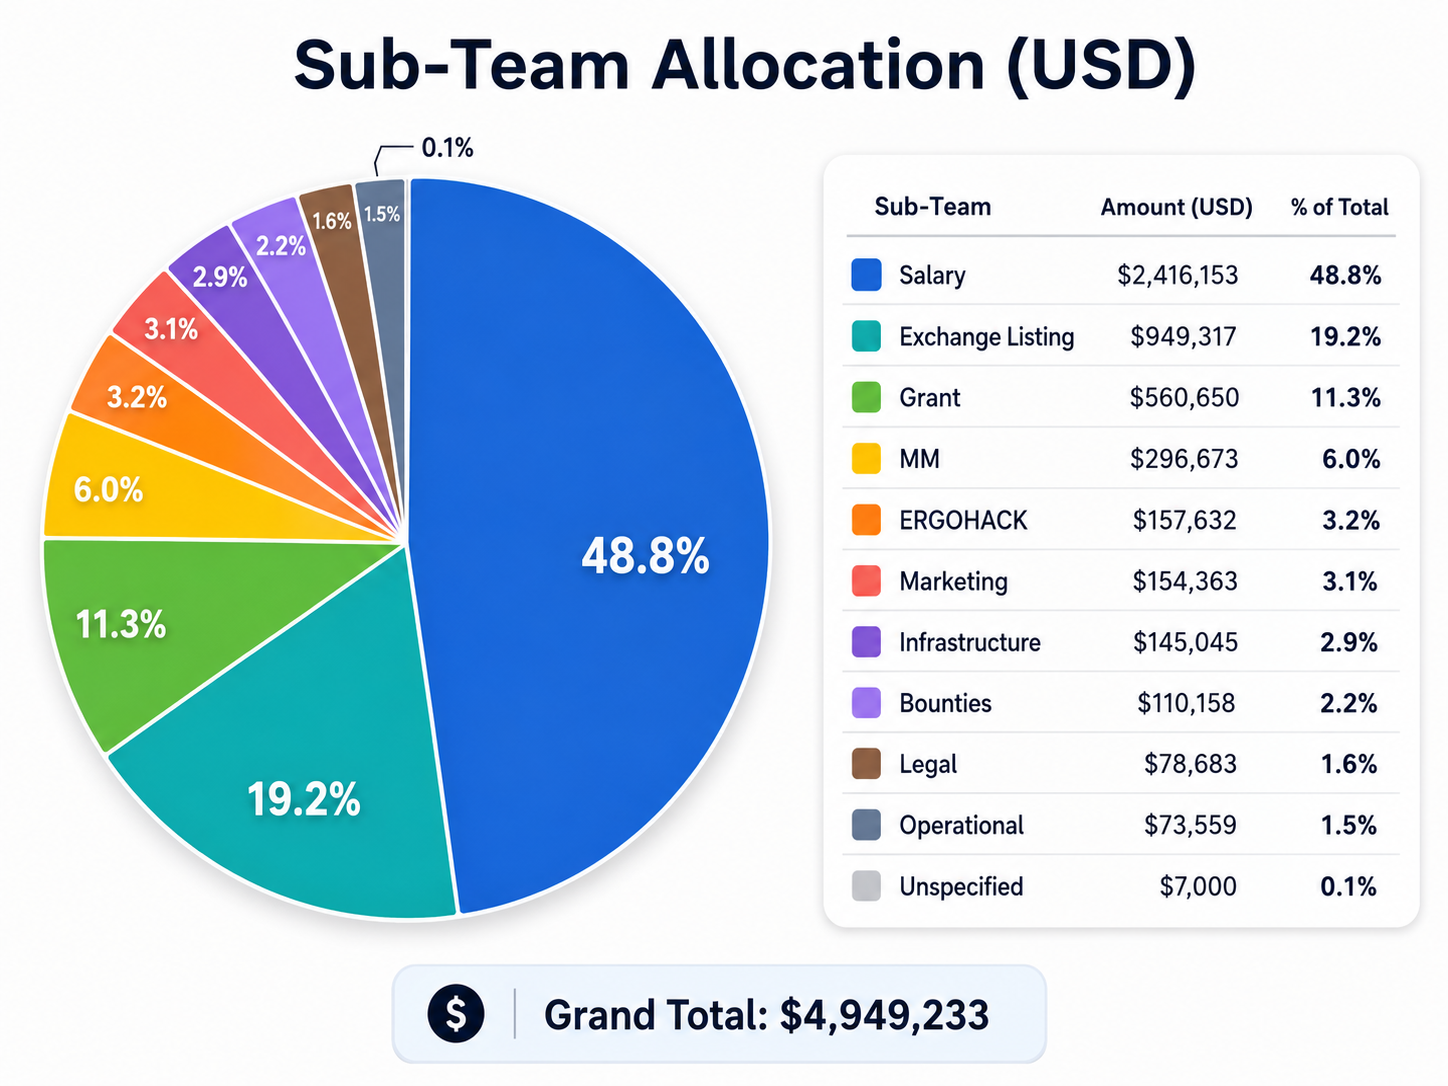
USD Withdrawals by Sub-Team#
Development and Ecosystem Spend by End Product#
This is not an exact science: when someone worked across multiple products or workstreams, their time has been estimated and split between the end products.
| End Product | SUM of Amount, USD |
|---|---|
| Sigma Rust | 288,412 |
| Sigma | 288,357 |
| Rosen | 287,257 |
| Early Monthly Salaries (Est.) | 180,000 |
| ERGOHACK | 164,292 |
| sigmaverse.io | 135,352 |
| Explorer | 134,038 |
| ErgoDex | 133,135 |
| Terminus | 125,852 |
| Nautilus | 117,045 |
| Mining | 77,491 |
| ergoplatform.org | 77,240 |
| docs.ergoplatform.org | 75,189 |
| Research | 66,951 |
| Node | 64,619 |
| Subscriptions / Server / etc | 61,947 |
| Dev Unknown | 60,666 |
| Yoroi | 46,735 |
| Auction House | 38,320 |
| SigMining | 19,969 |
| Sigmanauts | 18,704 |
| Ledger | 16,465 |
| ergonames | 12,180 |
| Cyberverse | 10,107 |
| Ergoversary | 7,500 |
| SigmaUSD | 7,020 |
| Gluon | 4,469 |
| Education | 4,340 |
| Lithos | 2,000 |
| ergo-nix | 1,123 |
| ErgoFund | 1,020 |
| Oracles | 200 |
| Subtotal | 2,527,995 |
Exchanges & Market Makers#
Exchange and market-maker names are anonymised here because many centralised exchanges require non-disclosure agreements and do not want listing or integration prices published. Market makers also generally do not want competitors to know their pricing or commercial terms. The totals are shown for transparency without disclosing counterparties or sensitive contract details.
| Entity | SUM of Amount, USD |
|---|---|
| Exchange #1 | 431,139 |
| Exchange #2 | 150,020 |
| Exchange #3 | 144,940 |
| Exchange #4 | 100,242 |
| MM #1 | 86,974 |
| MM #2 | 79,999 |
| Exchange #5 | 60,000 |
| Exchange #6 | 52,884 |
| Exchange #7 | 49,500 |
| Exchange #8 | 41,895 |
| Exchange #9 | 30,254 |
| Exchange #10 | 30,065 |
| MM #3 | 22,000 |
| Exchange #11 | 20,923 |
| Exchange #12 | 10,000 |
| Exchange #13 | 6,902 |
| Grand Total | 1,317,735 |
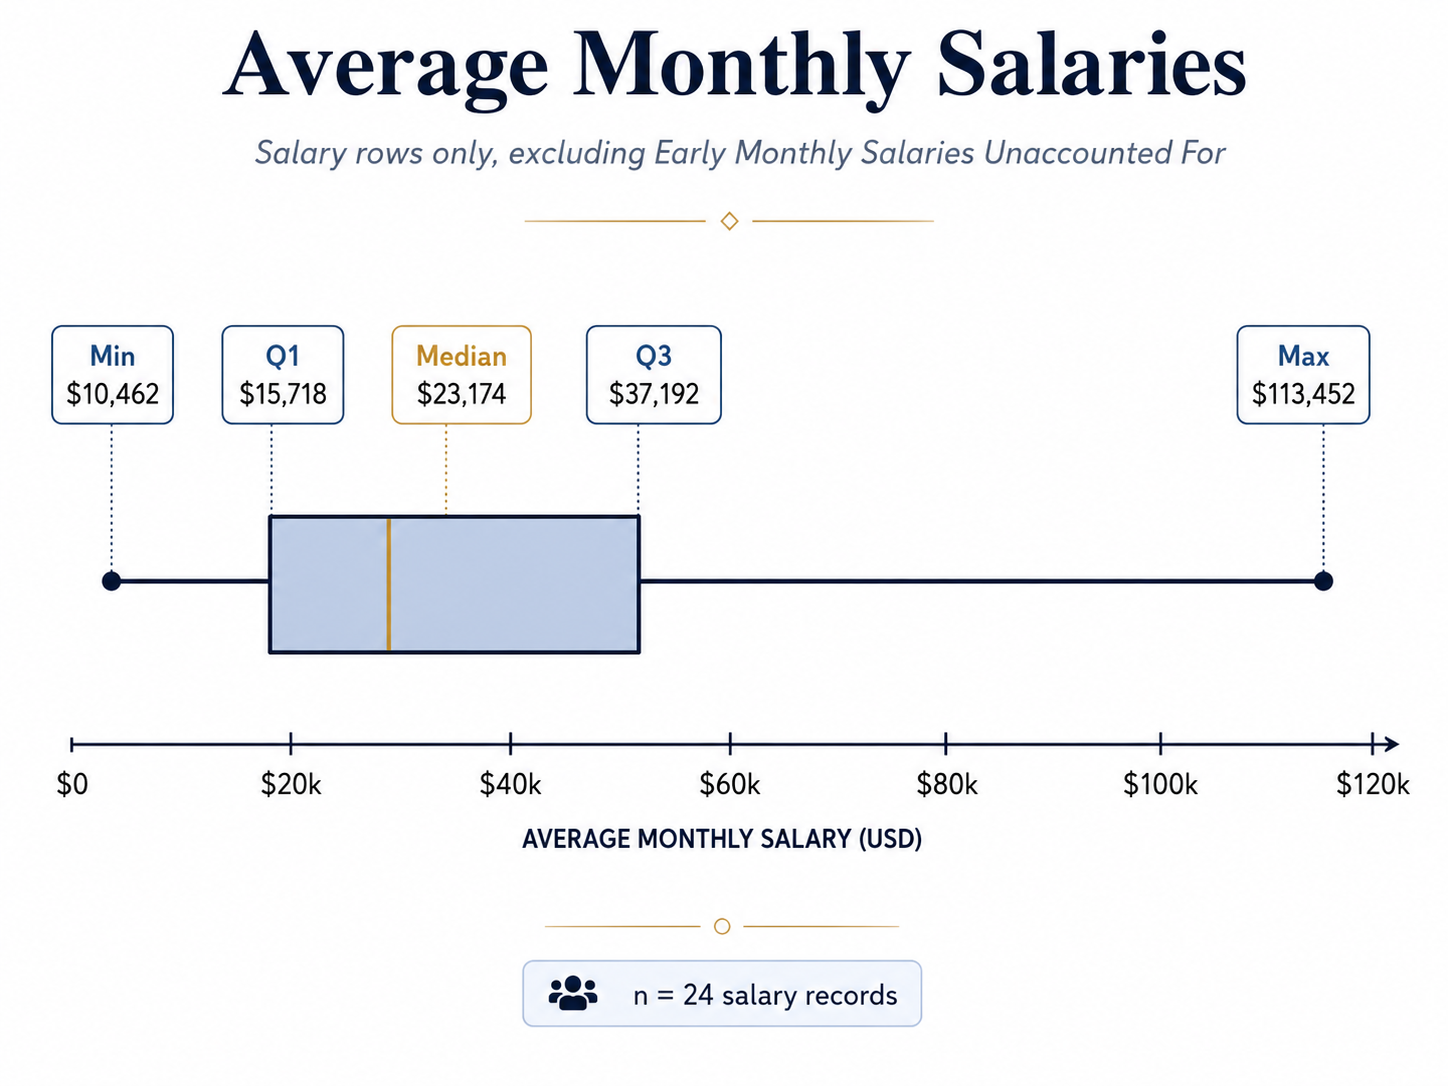
Salaries#
Several contributors have received monthly salaries or rewards for work on the Ergo ecosystem. Most were promoted from within the community after sustained contributions. The chart below compares total amount paid against years worked.
Salary Distribution by Contributor#
This chart shows the total paid to each person against the years they worked or contributed to Ergo.
Roles
More information on each of these roles can be seen on this page.
The Ergo Foundation's Future
Please see this page for more information on the long-term goals of the Foundation.